By Peng Zhao | August 16, 2018
A comment by the utopian.io moderator mentioned that the wordings of both 'followers but not following', 'following but not followers' are confusing. Although they are the official callings that I cannot change, a diagram could help. Therefore, I added a Venn diagram into the sfollow()shiny app.
A Venn diagram shows all possible logical relations between a finite collection of different sets. It is usually a diagram which consists of multiple overlapping circles, each representing a set. In a Venn diagram of the follower report, the pink area indicates the number of the steemians who follow the given ID (followers), the blue the number of those who are followed by the given ID, and the purple the intersection. The figure below shows the Venn diagram of a certain ID.
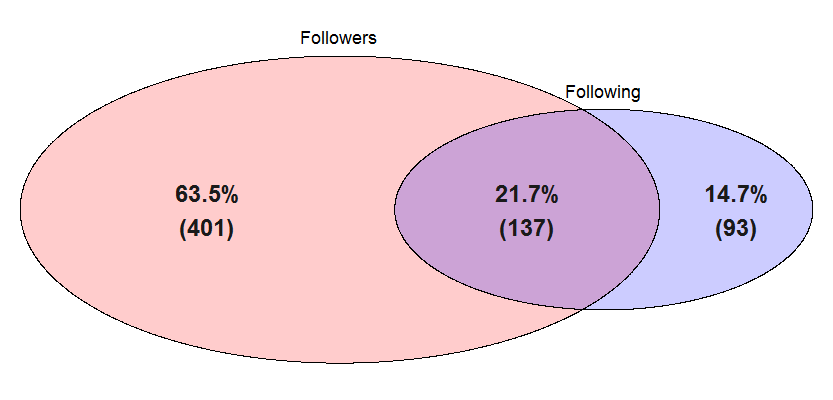 Figure 1. Guess whose Venn diagram is this.
Besides, I also added three wordcloud diagrams to display the levels of the followers ranked by the follower number, post number, and vests. By moving the sliders, users can choose the top n followers displayed.
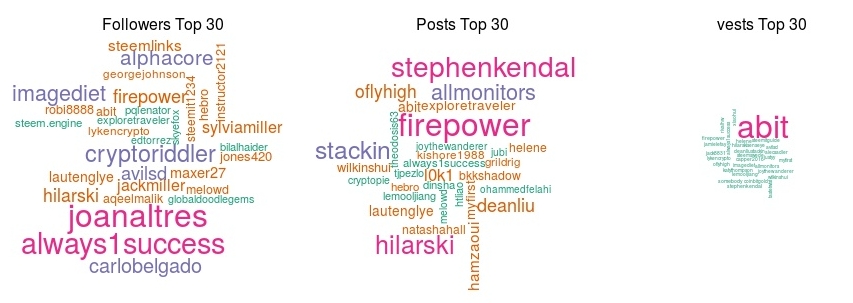 Figure 2. Wordclouds of the follower levels.
How did I implement them?
I added some user interface elements, including sliders, diagrams, and explanation texts, into the internal functions sfollow_ui() and sfollow_server() which are the UI function and server function for sfollow(). Each part of the functions are well documented. Other files were updated automatically by compilation.
Link to relevant lines in the code on GitHub can be found mainly in my latest commit (click to see the details):